One product. The whole picture.Interactive example
Your next best sellerOne order, one product
$80selling price
Product cost
−$24.00
Shipping & fulfilment
−$6.00
Payment fees (3%)
−$2.40
Customer acquisition
−$32.00
Contribution per order$15.60
19.5%margin
$8Move the slider$64
Break-even CPA: $47.60. Above this, each new order starts losing money.
Illustrative figures in USD. Excludes tax, refunds and overhead.
More sales are not the goal.More profitable sales are.
The questions behind the numbers
Sales are up. So why does profit feel stuck?
You do not need another report telling you revenue grew. You need to understand what is left after the sale — and what to do about it.
“We are selling more, but keeping less.”
Shipping, fees, product costs and acquisition can eat the margin that revenue hides.
“The ads look good. The business does not.”
Platform ROAS does not tell you whether the products sold can support that acquisition cost.
“I do not know what to scale next.”
A store-wide average can hide loss-making products and stronger opportunities.
A clearer view of your business
From store performance to the product behind it.
Bring sales, costs and advertising into the same conversation. Go beyond a store-wide ROAS to see where your margin is really coming from.
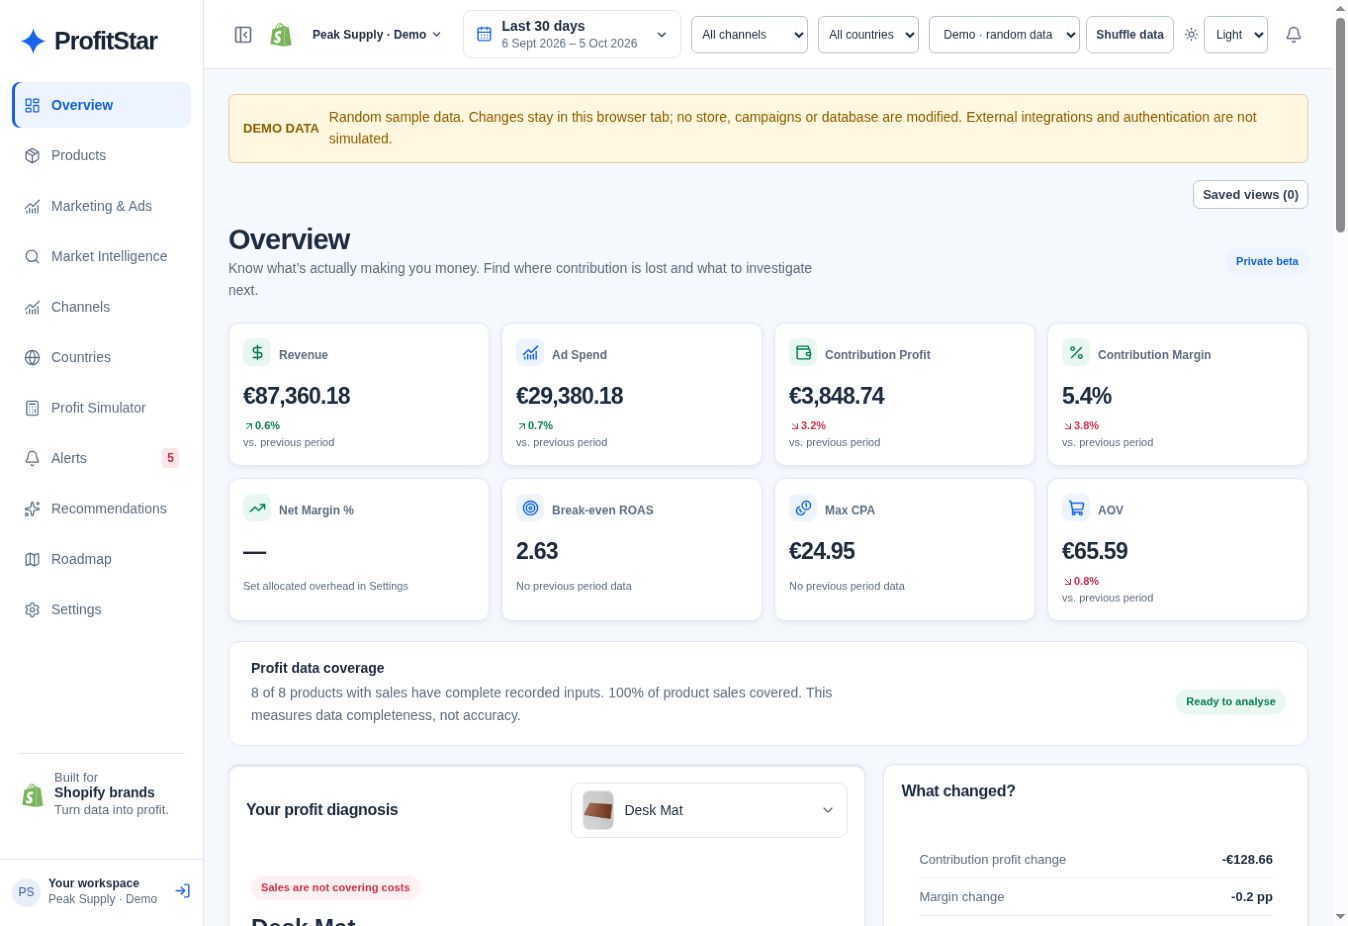
Your profit workspaceActual product preview · sample data
Explore the same dashboard with an interactive sample store.
Less guesswork. Better questions. Clearer decisions.
Each view connects a business problem to the numbers you need to investigate it.
Product profitability
Your best seller is not always your best earner.
Revenue rankings miss what products cost to sell. See contribution profit after recorded product costs, fulfilment, fees and allocated ad spend, with missing inputs flagged.
Decide which products deserve attention, not just more budget.
See where cost inputs are incomplete and where advertising allocation is estimated. Keep contribution profit separate from net margin, which needs allocated overhead.
Know what a number includes before using it to make a decision.
ProfitStar keeps the assumptions visible, so a confident-looking dashboard doesn’t hide an incomplete picture.
Missing costs stay visible
Incomplete inputs are flagged before a product’s profit is treated as confirmed.
Attribution has context
Estimated advertising allocations are labelled. Shopify revenue stays separate from platform-reported conversions.
You make the decisions
Investigate changes, compare periods and test scenarios. Your campaigns and prices stay under your control.
From data to a decision
A better starting point for your next move.
The demo is ready to explore. For approved beta stores, the workflow starts with your own Shopify data.
1
Bring in your sales
Connect an approved Shopify store and import its products and order data.
2
Complete the cost picture
Add product costs, fulfilment, fees and advertising spend. Review any coverage gaps.
3
Find your next action
Investigate profit leaks, check break-even and compare what-if scenarios.
Before you explore
Good questions. Straight answers.
ProfitStar is in private beta. The public demo uses sample data.
What does ProfitStar help me understand?
Which products contribute to profit, what you can afford to spend to acquire an order, and where recorded costs or advertising spend are putting margin under pressure. You can compare products, channels, countries and time periods.
Can I try it without connecting my store?
Yes. The public demo opens a sample Shopify store with example data. You can explore reports, change filters and model scenarios without signing in or connecting an advertising account. Demo figures are not customer results.
Can I connect my own Shopify store?
ProfitStar is currently in private beta. Live access is enabled separately for approved Shopify stores. The public demo lets you explore the product while live onboarding is being prepared.
How reliable are the profit figures?
Profit depends on the revenue, costs and advertising coverage available for your store. Missing inputs are flagged, and estimated attribution is labelled. Contribution profit is shown separately from net margin, which also requires allocated overhead.
How is advertising spend assigned to products?
Product reports use attributed advertising spend where the available data supports it, with clearly labelled estimates where allocation is needed. Revenue comes from Shopify; advertising platforms’ reported revenue is not added to Shopify sales.
Will ProfitStar change my campaigns or prices?
No. ProfitStar supports analysis and scenario planning. It does not automatically change campaigns, advertising budgets, products or prices.